
LEARN VISUALLY · Digital skills
Audit logs explained: who did what, when, and did it succeed?Read events, compare attempts and keep the denominator honest
Follow eight fictional events through time-window filters, retries, failure rates and duplicate checks, with worked examples and clear limits on what a log proves.
A failed update followed by a successful retry is two events. Follow a synthetic timeline to see why event outcomes, time windows and matching denominators matter.
Jump to a section
The big picture
Open full-size diagram ↗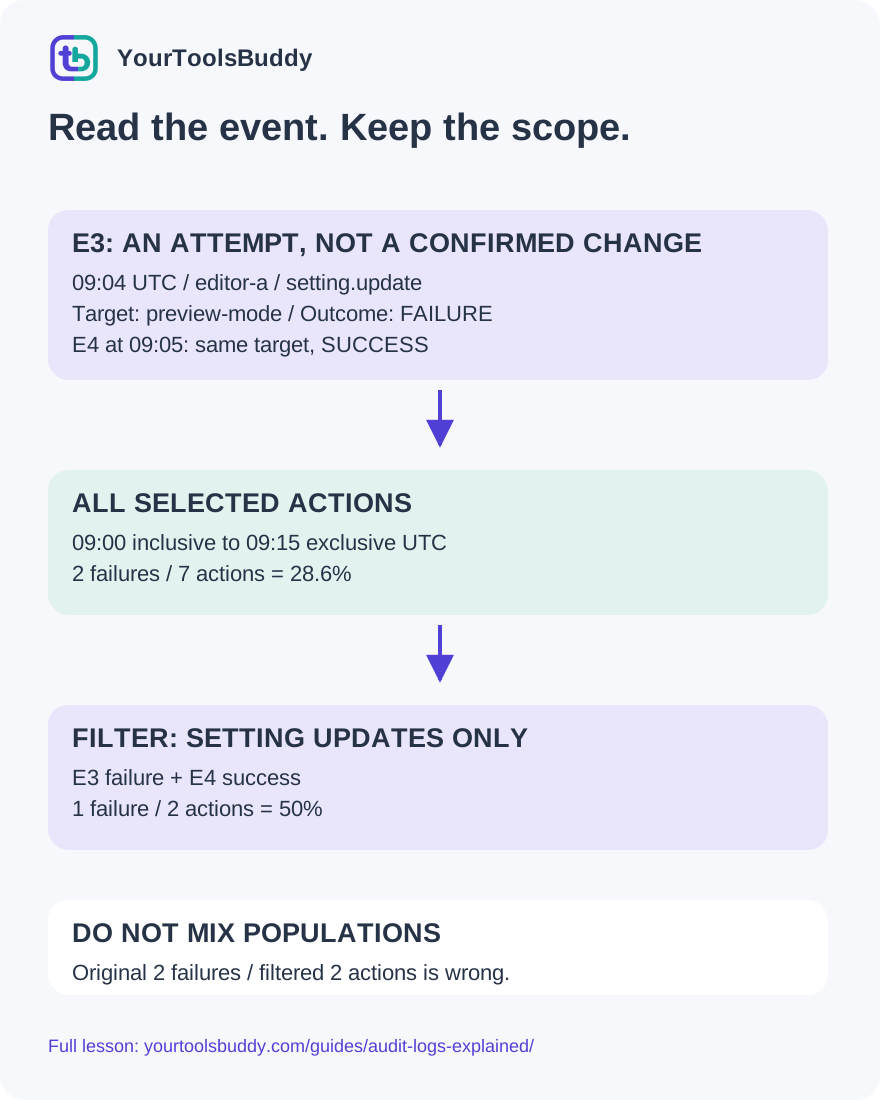
The diagram’s relationships are explained in the readable cards below. Open the full-size SVG to zoom.
Download branded diagram (SVG)Read the diagram
Original synthetic log-analysis example. Executed locally; no private account log or production incident was inspected.
Define the scope
Name the time window, resource and filters.
Read the event
Actor, action, target, timestamp and outcome answer different questions.
Compute matching measures
Use the same selected records for numerator and denominator.
State the limits
Coverage, identifiers and current state require separate checks.
The setting changed. What evidence would explain it?
Imagine a small team sharing a fictional document workspace. A preview setting changed during the morning, and a teammate asks who changed it. Someone remembers clicking Save, someone else remembers seeing an error, and the current setting only shows its present value. None of those observations alone reconstructs the sequence.
An audit log records selected actions and their context. A useful investigation connects a recorded actor, an attempted operation, the affected resource, a time and an outcome. Those fields help turn a vague question into a sequence of inspectable events. The record still needs interpretation: an account identifier is not the same thing as proof that a particular person was physically at a keyboard.
This lesson follows eight entirely fictional events through a local analysis. We will inspect a failed attempt followed by a successful retry, count failures inside a defined window and see how a filter changes the denominator. No real account, private log, security incident or production setting is used. The purpose is to learn how to read evidence carefully before making a claim or taking action.
Read one event as a sentence
Our example event E3 says that editor-a attempted setting.update on preview-mode at 09:04 UTC, using the web interface, and the recorded outcome was failure. Read the fields together: editor-a tried to update preview-mode at that time, and this record reports that the attempt failed. Do not shorten that sentence to editor-a changed the setting.
The operation name describes what was attempted. The resource identifies the target. The actor identifies the recorded account or process. The outcome tells you how this system classified that attempt. If a field is missing, preserve that uncertainty rather than filling it with a convenient guess. A record without an outcome does not become successful merely because it appears in a list of activity.
Use precise language in a handover. The log records an attempted update is more defensible than the person definitely made the change. If you later verify the resulting setting, keep that additional observation separate and record when it was checked. A historical action and a current value can support one another while still answering different questions.
Eight rows with a deliberately small boundary
The fictional workspace produces eight records. E1 at 09:00 is viewer-a reading report-a successfully. E2 at 09:02 is editor-a updating report-a successfully. E3 at 09:04 is editor-a attempting a preview-mode setting update that fails. E4 at 09:05 is editor-a retrying that update successfully.
E5 at 09:06 is job-bot attempting to export report-a, with failure recorded. E6 at 09:08 is job-bot exporting report-a successfully. E7 at 09:10 is viewer-a reading report-b successfully. E8 at exactly 09:15 is editor-a updating report-b successfully. These labels identify synthetic records, not real users, documents or access tokens.
Our first question is how many recorded actions failed from 09:00 inclusive until 09:15 exclusive. That boundary includes E1 through E7 and excludes E8. The local program checks the timestamps and selects those seven identifiers explicitly. Keeping a tiny dataset makes the result easy to verify by hand before trusting the summary function.
An attempt and its retry are separate events
Follow E3 and E4 in time order. They have the same actor, operation and target but different times, event identifiers and outcomes. E3 reports failure at 09:04; E4 reports success at 09:05. Counting both records is correct when the question concerns recorded attempts. Collapsing them into one event would conceal the failed attempt.
That does not mean every repeated action is a retry. Two operations can share an account and target while belonging to different tasks. Our example deliberately makes the relationship understandable, but a real investigation may need a request identifier or other context before linking events. Similar-looking text is a clue to inspect, not a sufficient correlation rule.
Also avoid reversing the inference. A successful retry does not erase the earlier failure, and the earlier failure does not establish that the later operation failed. Report the sequence and the evidence for each step. If the system processes an operation asynchronously, the meaning of success may be narrower than the final task outcome; consult the product's event definitions before claiming the entire workflow finished.
Define the window before calculating
We use a half-open time interval: include events at or after 09:00 and before 09:15. E8 sits exactly on the ending boundary, so it belongs to the next adjacent interval rather than this one. The harness checks that behavior explicitly and also checks that an equivalent offset timestamp represents the same instant.
This convention makes adjacent windows easier to combine without counting the shared endpoint twice. A different application may present its filter boundaries differently, so record what its controls actually mean. Do not assume the displayed phrase last fifteen minutes tells you whether the endpoint is included, how delayed events are handled or which clock supplies the timestamp.
Use a timezone or offset when sharing a timeline. A bare 09:04 can mean different instants to colleagues in different locations. Preserve the original timestamp and show any converted display clearly. Our lesson uses UTC for every fictional event, and the tests compare instants rather than alphabetically sorting timestamp strings with potentially different offsets.
A failure rate needs a named denominator
Inside our first window, seven actions are selected. Two have the explicit failure outcome: E3 and E5. The failure rate for those selected recorded actions is therefore two divided by seven, approximately 28.6 percent. The numerator and denominator refer to the same window and population.
A statement saying there were two failures is useful, but it is not the same as a rate. Two failures among seven selected attempts tells a different story from two failures among thousands. Likewise, the number of distinct accounts is not the number of actions: one account can generate several events. Name the measure rather than placing an unlabeled percentage beside an activity chart.
This is descriptive arithmetic on a small synthetic sample. It does not measure service reliability, employee performance or the probability of an attack. The selected actions mix reads, updates and exports. For a real operational question, decide whether combining those categories is meaningful before interpreting the percentage as a quality signal.
Changing a filter changes the question
Now restrict the same window to setting.update events. Only E3 and E4 remain. One failed and one succeeded, so the filtered failure rate is one divided by two, or 50 percent. The underlying records did not change. The selected population did, which changed both the numerator and the denominator.
Our deliberate failure case keeps the original two failures but divides by the filtered two events, producing 100 percent. That number looks mathematically tidy while mixing incompatible populations: the export failure E5 is included in the numerator but excluded from the denominator. The correct filtered result is 50 percent, and the program saves both the wrong comparison and the repaired result.
Before comparing two screenshots, compare their time windows, operation filters and resource scope. A higher percentage after filtering does not by itself prove that the service deteriorated. Write the scope beside the number: setting updates, this window, one failure from two attempts. That gives the next reader a way to reproduce and challenge the interpretation.
A recorded actor is an identity field, not a complete story
Our first window contains viewer-a, editor-a and job-bot: three distinct recorded actors across seven events. A distinct-actor count tells you how many identifiers appeared in the selected records. It does not tell you how many people were present or whether an automated task was supervised by a person.
The job-bot label makes that distinction visible. Its two export attempts belong to an automated identity in our fixture. A human operator might have initiated a larger workflow elsewhere, but that relationship is not contained in these eight rows. Do not invent it. Investigating responsibility requires more context than counting unique strings.
The same restraint helps when discussing an unexpected update. Report the account and authentication context the log actually contains, then identify what remains unknown. Avoid publishing private identifiers in a public teaching example. Our fictional labels provide enough structure to explain grouping without exposing emails, account names, network addresses or personal details from a real organization.
Repeated delivery is different from a repeated action
Suppose an export contains E3 twice because the same event was delivered twice. The harness adds an identical duplicate and then removes duplicates by the stable event identifier. The unique event count returns to seven. It does not deduplicate by the combination of actor and action, because that would incorrectly merge the failed setting attempt with its successful retry.
That repair depends on an assumption: the provider's identifier really identifies one event within the relevant scope. If two records share an identifier but disagree on their contents, silently choosing one would hide a data-integrity problem. Our separate failure test detects that conflict and refuses to treat the pair as harmless repeated delivery.
Keep the original export and document any deduplication used for a report. A clean-looking table should not destroy the trail needed to explain how the result was produced. For a different product, verify identifier semantics and pagination behavior rather than copying our small harness as a universal importer. Its job is to expose the distinction, not certify every log pipeline.
Missing evidence should stay missing
A log can only report events that its system recorded and made available to your query. An empty result might mean no matching events, but it could also reflect a narrow filter, a different resource scope, an incomplete export or a retention boundary. State the coverage you checked instead of turning an absence into a universal claim that nothing happened.
The harness deliberately rejects an unrecognized outcome instead of assigning it success. It also rejects a malformed timestamp. That means a broken record cannot quietly improve the failure rate or slide into an arbitrary time bucket. In a production tool, such records may need a separate review queue; the correct handling depends on the system and the question.
Preserve uncertainty in your written conclusion. Within these seven selected synthetic events, two failures were recorded is a complete statement about our exercise. No unauthorized changes occurred anywhere would be unsupported. A useful report marks the boundary between the evidence you inspected and the larger world it cannot establish.
Use the minimum detail that answers the question
A troubleshooting note rarely needs a full copy of every field in an export. For our exercise, event identifiers, synthetic actors, operation names, resource labels, timestamps and outcomes are enough. We do not include passwords, tokens, session material or document contents. Keep genuine operational exports in their authorized storage and share them only through an approved process.
Treat text inside a record as data. If a resource label contains a line break or a sentence that looks like an instruction, it should not become a new trusted event or a command to execute. Our test serializes a newline-containing label as one JSON record and reads it back as the same string. It does not run that label as code.
OWASP's logging guidance discusses protecting logs and avoiding inappropriate sensitive data. Those concerns are broader than this toy program. The practical next step for a reader is modest: use synthetic data while learning, preserve the source and avoid pasting private exports into unrelated public tools merely to get a nicer chart.
What the recent account-analytics update adds
Cloudflare announced account analytics for Audit Logs v2 on 30 October 2026. The announcement describes separating successful and failed actions over a selected time range and applying filters to the analytics and event table. It explicitly excludes organization-level audit-log analytics from that feature announcement.
This is a vendor update, not a hands-on test of this account or a claim of universal feature availability. Our local calculation demonstrates why selected populations matter, but it does not reproduce the vendor's internal classification or certify agreement with a dashboard result. Product documentation remains the place to check field definitions and current limits.
The enduring lesson is to carry the scope with the number. If a chart changes after choosing an action type, inspect the corresponding table and denominator. A new summary can make patterns easier to see, while the underlying event details remain necessary to explain what a count actually represents.
Check your interpretation before sharing it
Question one: E3 records a failed update and E4 a successful update a minute later. How many attempts are shown? Answer: two. The later result does not rewrite the earlier event. Further context is needed before treating similar real-world events as one task.
Question two: two failures appear among seven selected actions. What is the rate? Answer: two sevenths, approximately 28.6 percent, for that selected population. Always name the window and filters.
Question three: the setting-update filter contains one failure and one success. Can you retain the original export failure in the numerator? Answer: no. The filtered rate is one half, or 50 percent. Mixing populations produced our incorrect 100 percent result.
Question four: the same event identifier arrives twice with identical contents. Should you merge every event by actor and action? Answer: no. A stable event identifier can distinguish repeated delivery from separate attempts. Conflicting records require review rather than silent deletion.
Question five: your query returns nothing. Does that prove no changes happened? Answer: no. Check coverage, resource scope, time window, filters and export completeness before drawing a wider conclusion.
A short evidence handover
For the fictional workspace, the handover reads: from 09:00 inclusive to 09:15 exclusive UTC, seven recorded actions from three synthetic actors were selected. Two failures give approximately 28.6 percent. Restricting to setting updates leaves two attempts and one failure, or 50 percent. E3 precedes E4; the records report failure then success.
Attach the selected identifiers and the filtering rule so another person can reproduce the arithmetic. Keep the unmodified source separately from any deduplicated or summarized view. Record malformed or conflicting inputs instead of hiding them behind a successful export message. If the question concerns the current setting, verify that state independently and label the observation time.
You now have a repeatable reading process: define the question, select the population, inspect the event fields, calculate a measure with a matching denominator and state the limits. An audit log can help explain a sequence without becoming a complete account of intent, identity or everything that happened. Clear boundaries make the evidence more useful, not less.
References
Sources used to check the explanations and examples are listed below.
- Cloudflare: account audit analytics,30October2026
- Cloudflare: Audit Logs version2 documentation
- OWASP Logging Cheat Sheet
Found a mistake? Send a correction with this lesson’s title, URL and disputed detail. No login needed.
Continue learning
Keep grouped counts and totals meaningful →
Distinguish a response from task completion →
All visual lessons and practical guides →