
LEARN VISUALLY · Digital skills
Pivot tables explained: grouping rows without changing the totalFollow six sales rows into a summary you can verify
Group a six-row example by region and product, reconcile 40 units, compare compact and outline layouts, and repair filters, missing rows and double-counted subtotals.
North sold 23 units and South 17. See how six source rows become those groups, why count is different from sum, and what to inspect when a pivot total changes.
Jump to a section
The big picture
Open full-size diagram ↗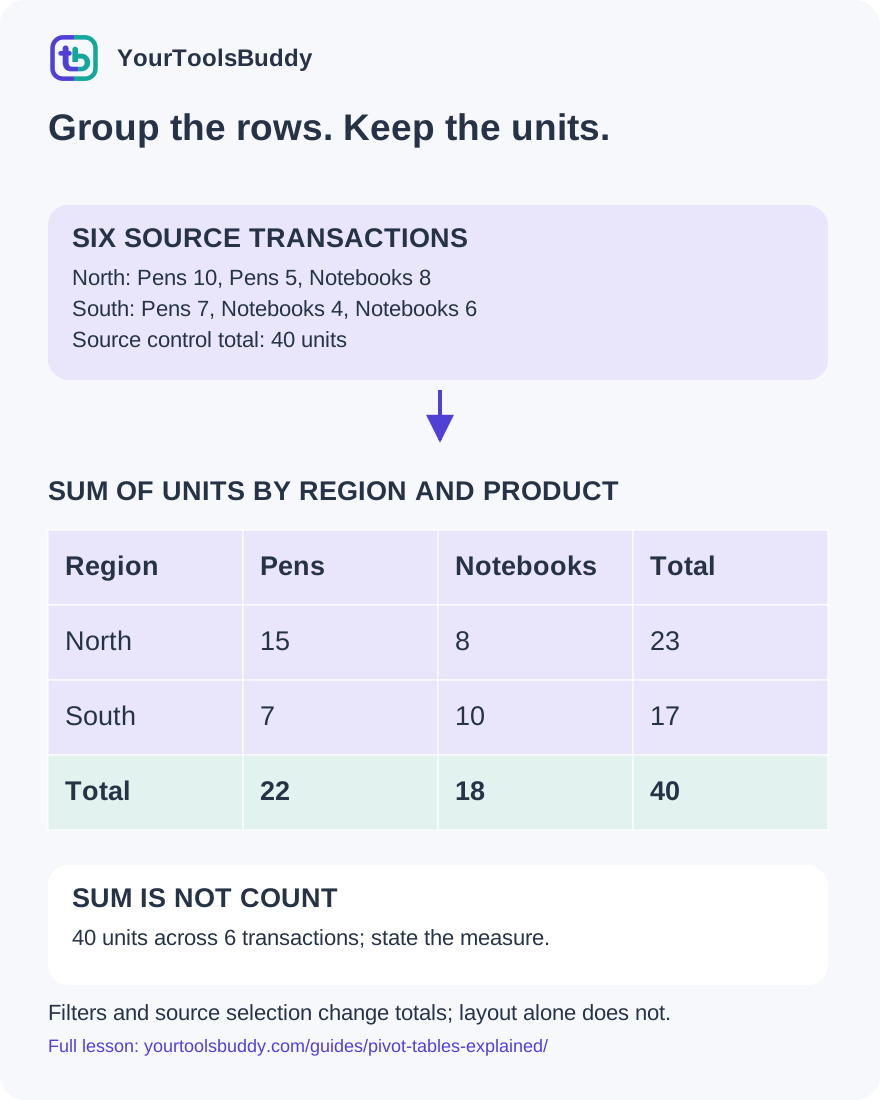
The diagram’s relationships are explained in the readable cards below. Open the full-size SVG to zoom.
Download branded diagram (SVG)Read the diagram
Original synthetic aggregation. Layout models and calculations executed locally; no Google account or Excel round-trip test claimed.
Define the population
Include the intended rows and state filters.
Choose the grouping
Each selected row contributes to its appropriate group.
Name the aggregation
Sum units, count transactions or calculate another explicitly defined measure.
Reconcile the result
Compare non-overlapping detail and totals; inspect range and labels.
Start with a question the rows can answer
You have six sales records and a colleague asks how many units each region sold. Reading every line aloud would answer the question eventually, but it would be difficult to compare regions. A pivot table creates a grouped summary: choose the categories that define each group, choose a value to summarize, and state the operation used to combine that value.
Our fictional stationery shop has North and South regions, Pens and Notebooks, and six transactions. We will follow all six rows into several summaries. The important check is that the same selected records, summarized by sum of units, still contribute the same grand total. Changing the display layout alone should not create or remove units.
This lesson uses an executed local aggregation exercise and original diagrams. It does not claim a hands-on test of a Google account or identical behavior in every spreadsheet application. We will deliberately change a filter, count records instead of units, omit a row and double-count a subtotal. Those failures make the boundary between a correct calculation and a misleading report visible.
Make the source understandable before summarizing
Use four columns: Transaction, Region, Product and Units. Our six rows are T1 North Pens 10; T2 North Pens 5; T3 North Notebooks 8; T4 South Pens 7; T5 South Notebooks 4; and T6 South Notebooks 6. Each transaction is a separate fictional sale, and Units contains a numeric quantity rather than a price or a label.
The independent total is 10 + 5 + 8 + 7 + 4 + 6 = 40 units. Write that control total down before building a grouped view. There are six source records, two regions and two products. Those are different counts with different meanings. A report showing six transactions is not wrong merely because the shop sold forty units; it is answering another question.
Keep one consistent meaning per column. If Units sometimes contains money or a note such as awaiting confirmation, the summary needs a data-quality decision before it needs a prettier layout. Preserve the original source and make any repair explicit. A summary should not quietly turn an unknown quantity into a confirmed zero or invent a value to keep the chart looking complete.
A grouping key decides which rows travel together
First group by Region and sum Units. The three North rows contribute 10, 5 and 8, giving North 23. The three South rows contribute 7, 4 and 6, giving South 17. The two grouped sums add to 40. In the executed exercise, every row belongs to one of those groups exactly once.
Notice what the summary hides. North 23 does not tell you that Pens appeared in two separate transactions or how the quantities were distributed across those transactions. Keep the source when that detail matters. A summary is useful because it reduces detail; that same reduction means it cannot answer every later question on its own.
Before changing fields, write the question next to the result: units by region, all six transactions. That short statement fixes the grouping, measure and selected population. It gives a reviewer something concrete to compare with the table. A heading saying sales summary is less helpful because sales could mean units, transaction count or revenue, and each would require a different interpretation.
Rows and columns are two ways to expose groups
Now group by both Region and Product. North Pens totals 15, North Notebooks totals 8, South Pens totals 7, and South Notebooks totals 10. We obtained those four groups from the same six records. The repeated North Pens and South Notebooks records are combined rather than displayed as separate transactions.
One useful presentation puts regions down the left and products across the top. The North row then reads Pens 15 and Notebooks 8, with row total 23. South reads Pens 7 and Notebooks 10, with row total 17. The product totals are Pens 22 and Notebooks 18. Both directions reconcile with the same grand total of 40.
Turning the presentation around can make a comparison easier without changing the underlying grouped values. A reader comparing product demand may prefer products as rows. A reader responsible for regions may prefer regions as rows. Choose the view for the reader's question, then check that the chosen labels still identify the measure and included records clearly.
The aggregation is part of the answer
Sum of Units answers how many units the selected rows contain. Count of transactions answers how many selected transactions there are. In our exercise, the region counts are North 3 and South 3, while the unit sums are North 23 and South 17. A column containing the number 3 therefore needs a label that tells the reader what was counted.
An average is another different answer. North has 23 units across three transactions, while South has 17 across three. An average per transaction must use that relationship, not simply repeat the region totals with a percentage sign. If the business question concerns revenue, neither units nor transaction counts supplies it because our source has no price or revenue column.
Do not choose an aggregation because it produces the largest or most attractive number. State the unit of measurement and check one group directly against its source rows. In a spreadsheet editor, inspect the selected summarization function rather than assuming an automatically suggested default matches your question. Our lesson's calculations are explicit sums and counts, not a claim about a particular application's default selection.
Compact and outline layouts can show the same hierarchy
A two-level row hierarchy can put Region above Product. Imagine a North heading with Pens 15 and Notebooks 8 beneath it, followed by a South heading with Pens 7 and Notebooks 10 beneath it. The hierarchy tells the reader which product result belongs to which region.
In an outline-style display, Region and Product can occupy separate columns. In a compact-style display, a shared label column can use indentation to show the levels. Our local exercise builds both representations from the same four grouped records and checks that each region-product value is unchanged. This is a comparison of our own layout models, not a test of Excel import or a vendor's interface.
A compact display can fit a narrow screen, but indentation must remain understandable. An outline display exposes the category fields more explicitly, which can help someone scanning repeated labels. Neither layout repairs missing source rows or an incorrect sum. Choose a readable layout after deciding the correct data and operation, and provide a text explanation when visual nesting alone could leave the relationships ambiguous.
A subtotal is a summary of detail, not another sale
Suppose the displayed North section contains Pens 15, Notebooks 8 and North subtotal 23. Adding all three displayed numbers gives 46. That arithmetic is correct for the numbers you added, but it counts the same North units twice: once through the product details and again through their subtotal.
Our deliberate failure test performs that addition and confirms the doubled result. The repair is to choose one non-overlapping level for the calculation. Add the two product groups to get 23, or use the already calculated North subtotal of 23. Do not add a parent total to the children it already includes.
The same caution applies when copying a pivot display into a new table. If a person pastes detail rows and total rows together as though every row were a new transaction, a second aggregation can inflate the answer. Keep a distinction between raw records and displayed summaries. A clear label such as subtotal helps a human, but the downstream calculation must also know which rows belong to its input.
A filter changes the population being summarized
Filter our original records to North only and sum Units again. The result is 23, not 40, because the three South transactions are now outside the selected population. The local test checks both results. A changed total is expected when the selected records change; it is not evidence that switching a display layout broke addition.
Name the filter in the report, especially when sharing a screenshot that cannot reveal the editor's settings. Units by region, North only tells a reader more than units by region. If the recipient compares the filtered total with an unfiltered source, explain which records were excluded before trying to force the figures to agree.
Also consider what happens when new source categories arrive. A saved list of allowed values may continue to omit a newly added category until its filter is reviewed. Check the actual application documentation and visible filter settings. In our synthetic exercise we deliberately select North in code, so the scope is unambiguous; we do not infer the state of anyone's spreadsheet from a screenshot alone.
A correct formula can summarize an incomplete range
Remove T6, the last South Notebooks sale of six units, from the selected input. The remaining five rows sum to 34. Our failure test confirms this result and then restores the omitted row to recover 40. The aggregation function did what it was asked to do; the input population was incomplete.
This is why a control total needs a source definition. Saying the pivot total is correct because its cells add up only proves internal consistency of the displayed subset. Compare the selected source range or table with the intended records. Check that the header is separate from data and that the newest row is actually included.
When a source changes, distinguish refreshing values inside the selected range from expanding that range to include additional records. Those are different operations even if an application makes one of them convenient. Google's help describes pivot refresh when source cells change; our omitted-row exercise is a separate local demonstration of why source inclusion matters. Verify the particular source range before making a claim about automatic coverage.
Category spelling is data, not decoration
A region called North and another called North followed by a space may be treated as different keys by a strict grouping operation. Our local harness deliberately changes one label and checks that the resulting group set splits. This is an explicitly strict comparison; it is not a claim that every spreadsheet trims or preserves labels in the same way.
The practical repair begins with a policy, not with deleting anything that looks inconvenient. Decide whether the two labels mean the same region, preserve the original value for review and apply a documented normalization if appropriate. A similarly spelled product might actually be a different product, so automatic cleanup should not guess from appearance alone.
For our fictional shop, a deliberate trim of the accidental surrounding whitespace restores the expected North and South groups. We test that restoration separately. The lesson is to make transformations visible and reconcile the result afterward. A matching grand total alone would not reveal a category split, because all forty units could still be present while the comparison between regions becomes misleading.
What the recent layout announcement changes
Google announced compact pivot-table layouts in Sheets on 28 October 2026. The announcement describes nested row labels in one column and improved preservation of that layout when importing from or exporting to Excel. These are vendor statements about layout and interoperability; we did not test a signed-in account or an Excel round trip.
The stated gradual Rapid Release rollout began on 22 October, while Scheduled Release starts on 6 November. Do not assume every account has the new option on the day of this lesson. The announcement lists Workspace and personal-account availability, but it does not establish the settings or feature visibility of an individual account.
The durable skill is to separate layout from calculation. If a source file changes from outline to compact presentation, compare the included records, grouping fields, measure and aggregation before deciding that the numerical result changed. Use a small permitted example and retain the original during any real file conversion. Our six-row exercise provides that control example without requiring access to private sales data.
Five checks you can explain to a colleague
Question one: North Pens has rows of 10 and 5 units. What is its sum? Answer: 15. It contains two transactions, so a count of two would answer a different question. Write the aggregation in the value heading.
Question two: North has product groups 15 and 8 and a subtotal of 23. Should you add all three to find North's units? Answer: no. That gives 46 by including the same detail twice. Use the subtotal or the non-overlapping product details.
Question three: filtering to North changes the grand total to 23. Did a compact layout lose South's sales? Answer: the filter excluded them. Check the selection before blaming the display. An unfiltered sum remains 40 in our example.
Question four: a selected source omits T6 and totals 34. Can a nicer layout recover the missing six units? Answer: no. Restore the intended input row and reconcile again.
Question five: the overall total is still 40, but North appears twice under slightly different labels. Is the report ready? Answer: no. Inspect category spelling and the normalization policy because total agreement alone does not establish correct grouping.
Share the question together with the result
Before distributing a pivot summary, attach a short description of its source, selected population, row and column groups, value field and aggregation. For our example that description is all six fictional transactions, Region by Product, sum of Units. The grand total is 40, with North 23 and South 17. Someone else can reproduce that statement from the six source rows.
Then inspect one detail group and one total. North Pens is 10 plus 5; North is 15 plus 8; the grand total is 23 plus 17. Check a filter and the selected range if the result differs. Keep subtotal rows out of any downstream input that expects raw transactions. Choose compact or outline presentation only after those meaning checks are clear.
Finally ask whether the report supports the decision being made. Our table describes units in a tiny fictional dataset; it does not prove profitability, future demand or business performance. A useful pivot makes a specific question easier to answer while preserving a path back to the source. The reader should understand both the summary and what it leaves out.
References
Sources used to check the explanations and examples are listed below.
- Google Sheets Help: create and use pivot tables
- Google Sheets Help: customize and filter pivot tables
- Google Workspace: compact pivot layouts,28October2026
Found a mistake? Send a correction with this lesson’s title, URL and disputed detail. No login needed.
Continue learning
Compare joining rows with summarizing them →
Read structured data in a web response →
All visual lessons and practical guides →